"As in all periods of speculation, men sought not to be persuaded by the reality of things but to find excuses for escaping into the new world of fantasy."
– John Kenneth Galbraith, The Great Crash 1929, published 1954
There is no limit to the number of financial charts an investor can follow. Data can be made to fit almost any hypothesis as analysts mine numbers to find unique insights. US academic, Campbell Harvey, has identified over 400 ‘factors’ that supposedly drive markets. His source is not an unknown trader with 20 screens in his garage. Harvey finds these well-researched factors in peer-reviewed papers appearing in leading financial journals, as described in ‘A Census of the Factor Zoo’. He says:
“Surely, many of them are false. We explore the incentives that lead to factor mining and explore reasons why many of the factors are simply lucky findings. The backtested results published in academic outlets are routinely cited to support commercial products. As a consequence, investors develop exaggerated expectations based on inflated backtested results and are then disappointed by the live trading experience.”
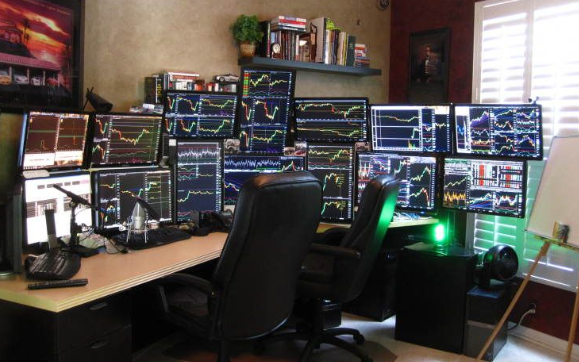
Recognised market measures are at extremes
With the qualification that charts can prove almost anything, the following selection is not drawn from obscure ratios and calculations, but the more accepted ways experts watch markets. At a time when stock markets are almost ignoring the economic slowdown caused by a global pandemic, even as bond markets throw out the warning signs, these ratios are at historical extremes.
1. The ratio of financial assets to GDP
Warren Buffett told Fortune Magazine in 2001 that if the ratio of the market value of financial assets to GDP (or GNP) rises rapidly, "you are playing with fire”. Buffett believed that over time, it should not be possible to build wealth faster than the growth of business or the economy. He said:
“The chart shows the market value of all publicly traded securities as a percentage of the country's business - that is, as a percentage of GNP ... it is probably the best single measure of where valuations stand at any given moment ... For investors to gain wealth at a rate that exceeds the growth of U.S. business, the percentage relationship line on the chart must keep going up and up ... That won't happen.”
Sorry, Warren, yes it will.
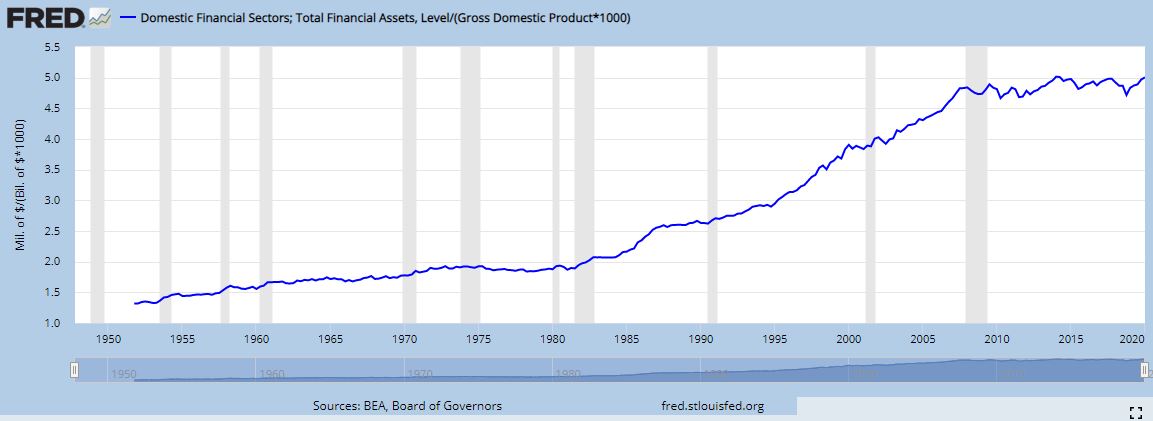
Policymakers have driven down interest rates, inflating the value of most investments. This is seen as a precursor to economic recovery as activity is stimulated, with Wall Street leading Main Street. But financial assets are now 5X US GDP when Buffett thought 2X was extreme. For a breakdown of inclusions in financial assets, see FRED Economic Data.
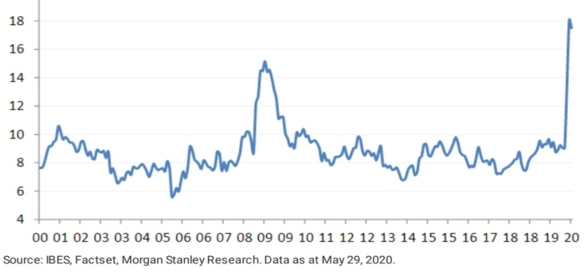
2. The dispersion of profit forecasts
From the thousands of stock analysts who dissect the results of companies and create complex spreadsheets of forecasts, there is usually a reasonable consensus. However, such is the uncertainty as companies withdraw guidance and analysts struggle to build in the impact of COVID-19 that the earnings per share estimates are at record high dispersion.
Top 200 listed companies in Australia, Earnings Per Share (EPS) Forecast Dispersion
3. The size of jobs fall and time to recovery
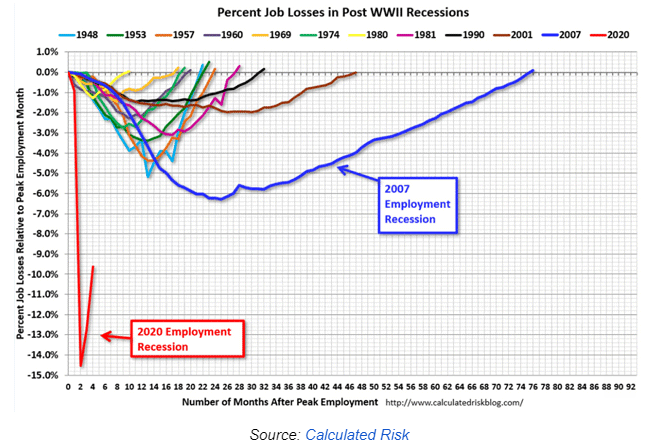
In the 12 recessions in the US since the Second World War, the shape of the U- or V-shaped recovery has varied significantly. The following chart shows the percentage job losses relative to the prior peak in employment in the US. Jobs returning to previous levels has taken from only a few months to many years in the case of the 2007 employment recession.
The red line below shows the current pandemic. While it seems to have hit the bottom, it is a long way back when the virus continues to threaten (California represents 15% of US GDP and has gone back into lockdown this week). Many companies will never return. If the experience of 2007 is repeated where job creation took 76 months to recover, the US is looking to 2026 or 2027 to return to normal. That does not sound like much of a V, especially when about 33 million Americans are receiving unemployment payments, or 24% of workers, but the official unemployment rate is only 11%.
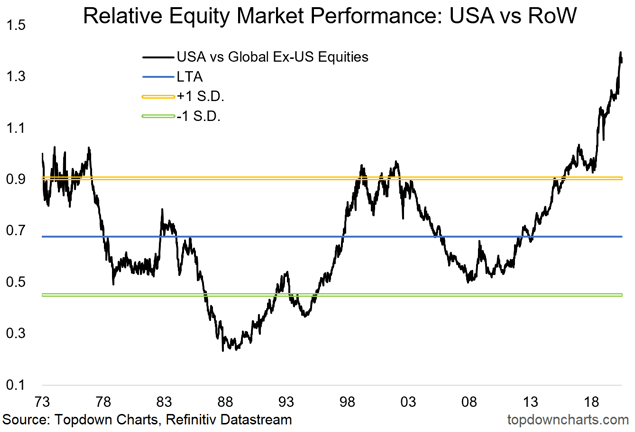
4. The value of US equities versus the rest of the world
We all know the incredible success of the large US technology companies such as Facebook, Apple, Amazon, Netflix and Microsoft. The top 5 companies now represent 25% of the market cap of the S&P500 (the largest concentration in 50 years) with the NASDAQ P/E ratio hitting 30 for the first time since 2004.
What is less well-known is the extent to which the US market has overwhelmingly outperformed the rest of the world. Most global equity managers not invested in the big US companies are having a torrid time against the global index. Those who made a convincing case to invest in the best from Asia or Europe or Less Developed Countries have been overshadowed by five or six excellent US companies.
Investing is about the future not the past, and many fund managers are now saying that the only value left in equities is outside the US. But who is game to bet against the NASDAQ tech story which just keeps running? According to analyst and commentator, John Mauldin:
“The last time the rest of the world was this consistently cheap vs US equities coincided with the peak in the previous big cycle of US vs global equities relative outperformance. Turning to valuations, the RoW index is just plain cheap versus USA stocks. It appears it is a matter of when, not if, global equities perk up vs US stocks. A remarkable 90% of countries offer better value than the US—a level bested briefly after the tech bubble in the early 2000s.”
5. The volatility of equities after a market rally
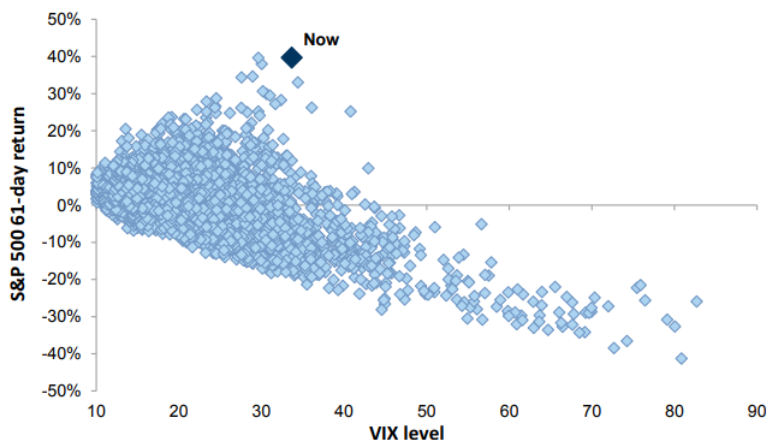
The VIX Volatility Index is a measure of the level of risk or fear in equity markets. Traditionally, the ‘fear index’ moves inversely to the stock market. This has appealing logic: as prices rise, investors become more relaxed and VIX falls.
However, according to a report in Zerohedge, the VIX has never been this high after such a strong rally in the 61-day S&P500, as shown below. The chart indicates how the VIX becomes elevated when markets fall, with a big cluster of low volatility when the market rises. The current combination of high returns and high volatility is rare.
6. The performance of commodities relative to equities
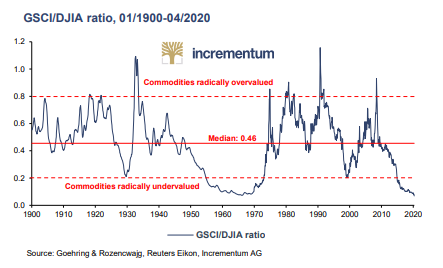
A common measure of the performance of a wide range of commodities is the S&P GSCI (Goldman Sachs Commodities Index). It is a benchmark for investment in commodities and is a tradeable index equivalent to a stock index such as the S&P500 or Dow Jones Industrial Average (DJIA).
The ratio of the GSCI to DJIA is at its lowest level in 50 years and almost touches the 120-year record. According to the chart below, this places the index in the ‘commodities radically undervalued’ region. Of course, it is a ratio of one number to another, so it also means ‘equities radically overvalued’ relative to commodities. It’s even more surprising when the components of the GSCI are so varied:
“The index currently comprises 24 commodities from all commodity sectors - energy products, industrial metals, agricultural products, livestock products and precious metals. The wide range of constituent commodities provides the S&P GSCI with a high level of diversification, across subsectors and within each subsector.”
When markets are at extremes, something must give
While reversion to a mean can take many years, decades of well-known financial ratios will not remain at these new extremes forever.
A common theme in five of the charts above is that equities are expensive, which makes the sixth chart of record job losses and a long recovery all the more important.
A foundational text on investing was written by Graham & Dodd in 1934, and it remains relevant today:
"Instead of judging the market price by established standards of value, the new era based its standards of value upon the market price. Hence, all upper limits disappeared, not only upon the price at which a stock could sell, but even upon the price at which it would deserve to sell."
– Benjamin Graham & David Dodd, Security Analysis, 1934
Graham Hand is Managing Editor of Firstlinks. This article is general information and does not consider the circumstances of any investor.