The Weekend Edition includes a market update plus Morningstar adds links to two additional articles.
Recently, KPMG Urban Economist, Terry Rawnsley, did some great analysis on generational wealth in Australia, using ABS figures to June last year. His firm put out a media release proclaiming, “The great wealth transfer begins as Gen X overtake Boomers for housing and shares”, and the Fairfax press ran with that in their own headline, “From grunge to Grange: How Gen X became wealthier homeowners than Boomers”.
A closer analysis at the data, though, suggests these headlines are wrong: while the great wealth transfer may have started, Boomers are still the wealthiest when it comes to housing and total net worth, and younger people are loading themselves with a lot more debt as they seek to get ahead.
To see why, let’s look at the numbers.
Wealth in housing
The figures reveal that Generation X has the most significant amount of wealth in housing, with an average value of $1.31 million per person, marginally in front of Baby Boomers at $1.30 million.
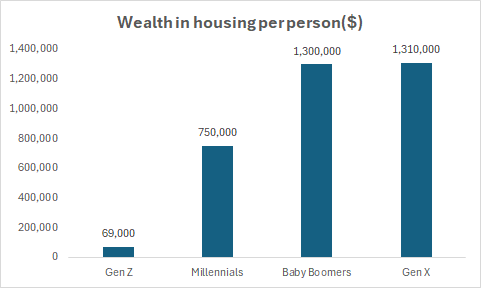
Figures as at June 30, 2024. Source: ABS, KPMG
These numbers include any property owned, such as primary residences, investment properties or second homes.
“Baby Boomers have historically been the largest holders of housing assets, but as this cohort ages into retirement they are beginning to sell down their property portfolios,” Rawnsley says.
On the other hand, many Gen Xers are upgrading from their first homes to something more.
Meanwhile, Rawnsley highlights the lower wealth in housing of younger cohorts, as Millennials and Gen Z, who face greater challenges to enter the housing market:
“While the starter’s gun has been fired on the great wealth transfer, our findings still demonstrate a clear disparity in housing wealth between older and younger generations.”
Rawnsley notes that for younger Millennials and older Gen Zs, the home ownership rate is 10 to 15 percentage points lower than at the same ages for Baby Boomers.
Don’t forget about debt
It’s settled, then: Generation X has overtaken Baby Boomers for wealth in housing. Well, not quite. Because the above figures only consider the asset side of the equation. They exclude debt.
And when it comes to debt, Baby Boomers are far better off than Gen Xers or Millennials. The latter have gross debt of $448,000 and $410,000 per person respectively. That’s 5-6x more than the $82,000 in debt held by the average Baby Boomer.
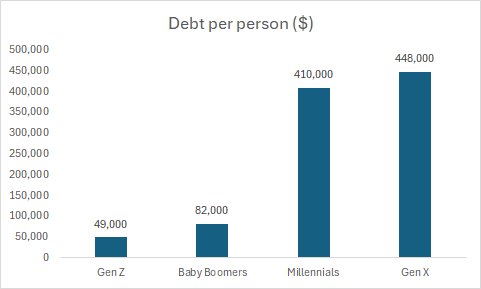
Figures as at June 30, 2024. Source: ABS, KPMG
It’s worth noting that these debts include all loans, not just housing. However, while there isn’t a breakdown of housing debt in these numbers, Rawnsley acknowledges that they’re likely to account for the vast majority of the gross debt figures. If right, it means that Gen Xers aren’t wealthier than Boomers when it comes to housing: their houses may be worth more, but they’re holding more debt against those houses.
Other assets
This doesn’t tell the full story of wealth among different generations. There are other assets to consider.
Of cash and deposits, Baby Boomers lead with $242,000 followed by Gen X with $176,000, while Millennials and Generation Z hold $104,000 and $26,000 respectively.
"Baby Boomers' are gravitating towards liquidity and higher cash holdings which reflect their inclination towards safer investments," Rawnsley says.
When it comes to shares, Gen X has the most, valued at $256,000. Baby Boomers hold $206,000 in shares, highlighting Boomer desire for less risky assets. Meanwhile, Millennials and Gen Z have considerably lower amounts, with $51,000 and $7,000 respectively.
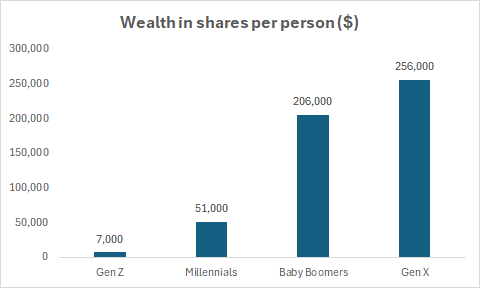
Figures as at June 30, 2024. Source: ABS, KPMG
"These lower levels of share ownership among younger generations indicate a cautious approach towards equity markets, possibly due to financial pressures and less cash to invest," Rawnsley comments.
Other assets, mostly superannuation and business assets, show Baby Boomers and Gen X with comparable holdings, $641,000 and $586,000 respectively. Millennials and Gen Z hold $260,000 and $43,000 in other assets.
“There is some good news for younger generations in the superannuation asset class as they are coming off a far higher base than their parents. This means the wealth they will eventually accumulate from super will be far higher than older generations,” Rawnsley says.
Net worth
Adding it all up, which of the generations is the wealthiest? It turns out that Baby Boomers remain well out in front, with net wealth per person of $2.31 million, 23% higher than the $1.88 million of Gen X, and about 3x greater than that of Millennials.
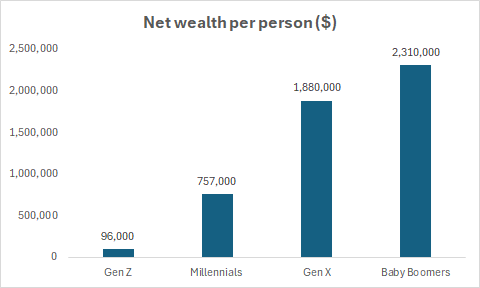
Figures as at June 30, 2024. Source: ABS, KPMG
"These net worth figures highlight the wealth accumulation lifecycle, where older generations have had more time to build assets and pay down debt," says Rawnsley.
The gross debt held against net worth tells a tale. It’s 54% for Millennials, 51% for Generation Z, 24% for Generation X, and just 4% for Baby Boomers.
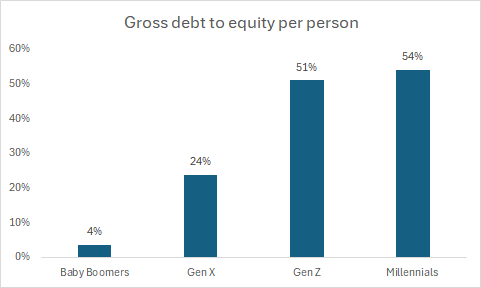
Figures as at June 30, 2024. Source: ABS, Firstlinks calculations
Summing up, the KPMG analysis shows Baby Boomers are still the wealthiest generation in Australia by far, and younger people are taking on more debt to try to catch up to them. It also underlines the extent that housing has driven the gap between generations.
----
In my article this week, I outline renowned investor Howard Marks' reservations about the current market and his musings on whether we've entered another investment bubble.
James Gruber, Editor
Also in this week's edition...
Firstlinks welcomes well-known Australian housing expert, Michael Yardney, this week. Michael gives us his outlook for 2025 and the key drivers that will shape whether it's a positive one for property owners.
On outlooks, Fidelity International's Niamh Brodie-Machura and Marty Dropkin consider the opportunities in global equities. They're bullish on the US and Japan, and see the potential for income investing to come back in vogue.
Last year, we had two articles on the issues concerning the unfunded liabilities of Commonwealth defined benefit schemes. Today, we have a follow-up specifically on the Commonwealth Superannuation Scheme (CSS). Bruce Bennett highlights how the scheme is no longer fit for purpose as its members now find themselves disadvantaged in several important ways versus those in other super funds.
AI has captured investor imagination, yet Capital Group's Matt Reynolds says there are a number of other exciting investment themes for the next decade, including more niche areas like gene editing and RNA interference.
Debt recycling is a potential strategy for those juggling the seemingly competing goals of debt reduction and building an investment portfolio. However, Alex Berlee says it's often misunderstood because there's more than one way to do it. He provides an overview of the pros and cons of different debt recycling strategies.
Globally, nuclear power is gathering momentum as a differentiated power source in the energy transition to zero carbon emissions. Yet in Australia, a nuclear ban remains, and Stuart McKibbin questions why that is.
Two extra articles from Morningstar this weekend. Joseph Taylor quizzes an analyst on APA Group’s weak share price, while Margaret Giles highlights ten US blue-chip shares to hold for the long-term.
Lastly, in this week's whitepaper, VanEck says markets are priced for perfection, though there are still opportunities for investors who are willing to dig a little deeper.
****
Weekend market update
December job gains were the biggest since March and well above the 155,000 jobs economists expected, while the unemployment rate fell to 4.1%. The data was the latest sign the labor market might be gaining steam again, shutting the door on a rate cut at the Fed’s January meeting. The &P 500 finished 1.5% lower while the Nasdaq was down 1.6%. Yields on the 10-year Treasury note and 30-year Treasury bond jumped to their highest closing levels of the past 14 months. The 10-year yield spiked 9.2 basis points to 4.772%, while the 30-year rate rose 4.2 basis points to 4.962% after briefly rising above 5%. Fresh US sanctions on Russian oil supplies drove crude oil 3.6% higher to US$76.62 a barrel.
From AAP netdesk:
The Australian share market on Friday finished lower for a second day, pressured by rising US bond yields. The benchmark S&P/ASX200 index on Friday dropped 35.1 points to 8,294.1, a loss of 0.42%, while the broader All Ordinaries fell 34.1 points, or 0.4%, to 8,543.7. The ASX200 gained 0.5% for the week.
Ten of the ASX's 11 sectors finished lower on Friday, while materials/mining climbed 1%.
The financial sector was the biggest loser, dropping 1.2% amid losses for all of the big four banks. Westpac and CBA both dropped 1.7%, to $32.60 and $156.05, respectively, while NAB subtracted 1.1% to $37.95 and ANZ dipped 0.3% to $29.29.
It's possible traders were taking profits from banks and rotating into the beaten-down mining sector.
BHP rose 1% to $39.68 and Rio Tinto grew 2.2% to $119.04, with Fortescue edging 0.1% higher at $17.93.
Goldminers were ascendant again as the precious metal changed hands at a four-week high of $US2,672 an ounce. Evolution rose 1.4%, Newmont gained 1.6% and Westgold recouped some of Thursday's losses with a 4% gain.
Star Entertainment Group was the worst performer for a second day, plunging 15.4% to an all-time low of 11 cents as Queensland Premier David Crisafulli rejected a bailout for the cash-burning casino company, which is rapidly running out of money.
Back in the financial sector, Insignia Financial grew 2% to $4.12 after reports Brookfield was weighing a bid for the wealth manager, which is considering an offer from CC Capital Partners.
Curated by James Gruber, Leisa Bell, and Joseph Taylor.
Latest updates
PDF version of Firstlinks Newsletter