The Weekend Edition includes a market update plus Morningstar adds links to two additional articles.
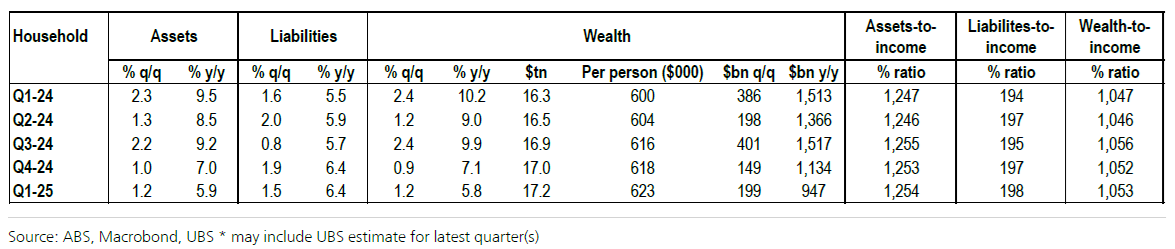
New figures from UBS show that household wealth in Australia has reached a record-high $17.2 trillion this year, up 6% or $950 billion over the past year. Household wealth per person is now $623,000, among the highest in the world.
However, the growth in wealth has slowed in recent quarters, principally due to stagnating property prices and lower returns from share markets.
Household assets, liabilities, and wealth
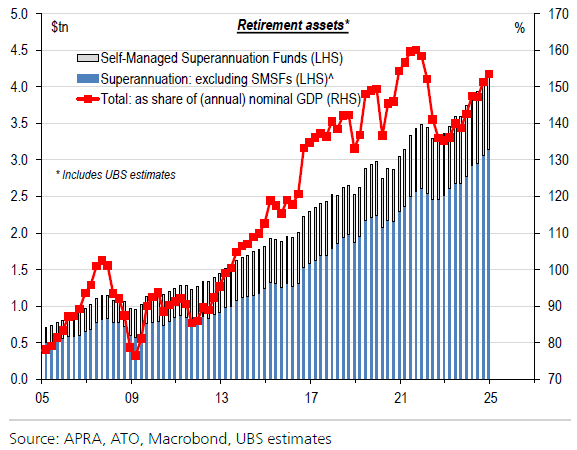
Retirement assets boom
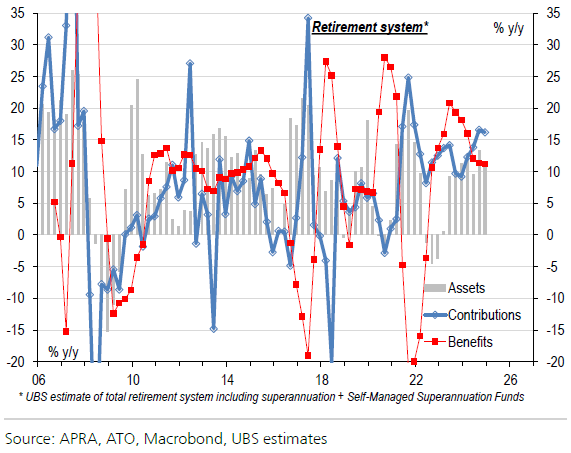
Total retirement assets – including super and SMSFs – increased by 11% Year-on-year (YoY) in the fourth quarter of last year to a record-high $4.2 trillion. If super and SMSFs continue to grow at this rate, it means their total assets will increase by $1 trillion every two years.
The fourth quarter rise in assets was driven by growth in super contributions. Coupled with strong asset returns, it resulted in super inflows again exceeding outflows.
Total retirement system assets
Total retirement system assets, year-on-year growth
APRA-regulated super funds grew assets to $2.9 trillion in December quarter, up 3.1% on the previous quarter and 14% over the prior year. Industry funds contributed most to this rise, and they continue to dominate the super landscape, accounting for 51% of total APRA-regulated assets, up from 49.7% the year before.
Superannuation assets
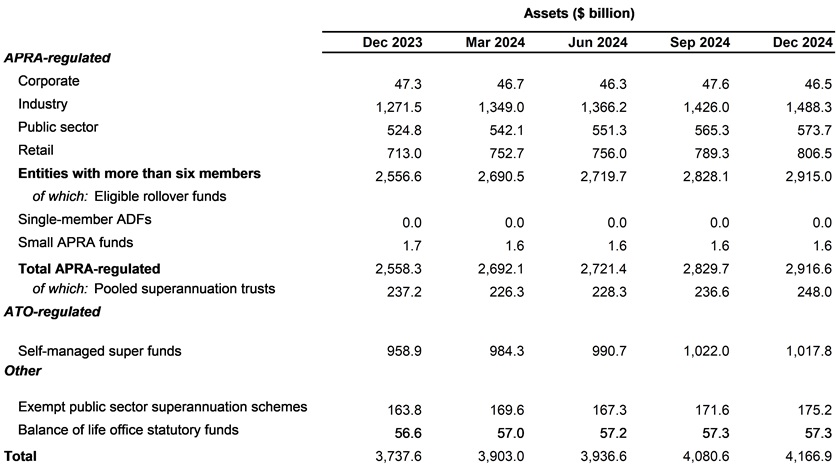
Source: APRA
SMSF assets slide marginally
As the chart above shows, SMSF assets dipped to $1.018 trillion in the fourth quarter, though they were still well up over the year.
While assets slid, SMSF member numbers still grew. ATO figures show there are now 638,411 SMSFs, a net rise of 8,727 in the December quarter and almost 27,000 over the previous year.

Source: ATO, Firstlinks
The figures reveal the majority of SMSFs have assets between $500,000 to $5 million (64%), with 23% holding between $200,000 to $500,000. And while SMSFs are attracting younger members, 85% are still 45 years or older.
As for where SMSFs are investing their money, listed shares still dominate at 27% of total assets, followed by cash and deposits at 16%, unlisted trusts at 13% and commercial property at 11%.
SMSF asset breakdown
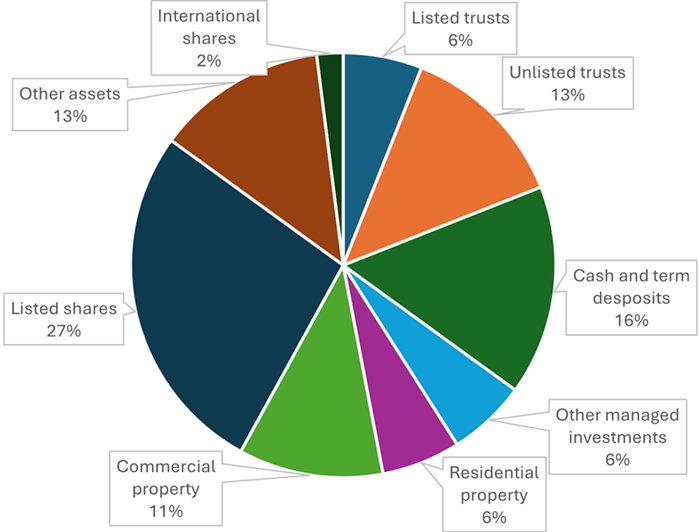
Source: ATO, Firstlinks
The two things that stand out in the above chart are the large cash holdings and the small allocation to international shares. On the former, that may change given the lower fixed term deposit rates now on offer. Regarding the latter, it’s hard to tell if this is an accurate figure or not.
However, it does correlate with a recent University of Adelaide study which found that a lack of exposure to overshares shares, especially US tech, had cost SMSFs in recent years:
“Home market bias, limited international diversification, and the drag of small SMSFs were the key drivers of SMSF underperformance compared to APRA-regulated funds in the 2022-23 fiscal year,” the report said.
The data showed that the median rate of return for SMSFs in the year ended June 30, 2023, was 6.8% compared with 8.4% for retail and industry funds.
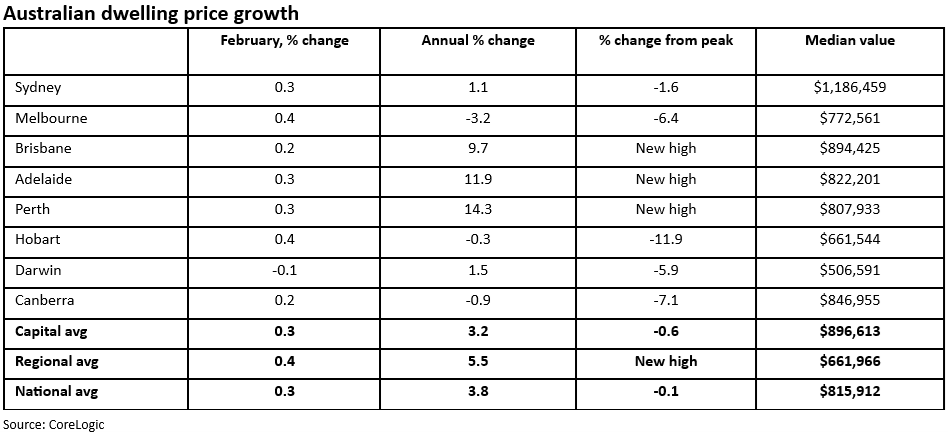
House pricing: turning back up?
Though super is important, residential property remains the key driver of wealth in Australia. The residential property market is valued at $11.1 trillion, accounting for about 64% of total household wealth.
And though it’s been a drag on wealth in recent months, that could be about to change as the latest data indicates that the housing market may be bottoming. Average home prices rose 0.3% in February, after a brief three-month downturn of just 0.4%. The upswing came in anticipation of, and then confirmation of, an RBA rate cut which boosted buyer confidence. Most cities saw gains with the recent losers of Melbourne, Hobart, Canberra and Sydney picking up as the booming cities of the last two years – Brisbane, Adelaide and Perth – continue to slow as poor affordability impacts them.
Whether the housing upturn continues will depend on the next RBA moves, whether population growth continues to slow, and which party wins the Federal Election and their economic priorities.
The soft spot in the wealth boom
If there’s a soft spot in Australia’s growing wealth, it’s debt. The household liabilities-to-income ratio has ticked up to a near-record of 198%, according to UBS. That’s among the highest in the world, albeit the ratio has remained relatively flat over the past seven years.
However, the household wealth-to-income ratio is higher still at 1053%.
Household liabilities-to-income ratio hit near record levels
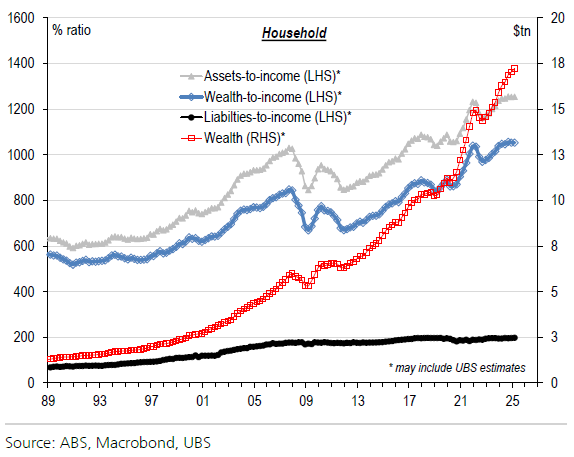
What this shows is how a multi-decade asset and debt boom has underpinned our wealth boom. And how we’re dependent on more rises in asset prices to spur further gains in wealth.
The issue is that asset prices have detached themselves from incomes to such a degree that it’s led to the current ‘cost-of-living crisis’. And it’s likely a big reason why the growth in Australia’s wealth has slowed over the past year.
In sum, Australia remains a fabulously wealthy country, though the foundations of that wealth have started to fray in recent years.
****
In my article this week, I revisit one of my most popular articles from last year, 16 ASX stocks to buy and hold forever, and answer the many questions I’ve got from readers since that time, including what stocks on the list may be worth buying now and whether I’d make any changes to the list.
James Gruber
Also in this week's edition...
Julie Steed outlines the key superannuation rates and thresholds that will apply from 1 July 2025, following the recent release of earnings and CPI data. She'll also detail the primary considerations and opportunities leading up the end of the financial year.
Reporting season saw some volatility in the share prices of the Big Four banks, after their barnstorming performance in 2024. What lies ahead for the banks? Hugh Dive takes a closer look.
Understanding investment risk in superannuation is crucial for your retirement account. UniSuper's Annika Bradley has a guide on how to define, take, and manage risk to select the right investment mix for you.
Mid-last year, Warren Bird wrote of how money supply growth was the 'forgotten' indicator of inflation, and that it signalled moderating inflation for the following 6-12 months. That proved correct, and Warren gives us an update on where we sit now.
Emerging markets get a bad rap even though they've delivered strong long-term returns. Siddharth Jain thinks their underperformance over the past 5-10 years is set to turn around thanks to an inflection point in earnings.
Has Australian commercial property bottomed? Charter Hall's Steven Bennett and Sasanka Liyanage say a sharp fall in supply and renewed demand points to a better 2025.
Two extra articles from Morningstar this weekend. Joseph Taylor quizzes an analyst on how tighter gaming rules and lower booze consumption could hit Endeavour, while Roy Van Keulen looks at the latest earnings from tech darling Life360.
Lastly, in this week's whitepaper, Allianz Retire+ explores the unique challenges and opportunities with retirement planning and the need to adjust to the demands of today's environment.
****
Weekend market update
On Friday in the US, stocks caught a mid-day bid to leave the S&P 500 higher by about half a percent, shaving the week’s losses to 3.3%, while Treasurys remained under pressure with 2- and 30-year yields rising to 3.99% and 4.62%, respectively, up three and four basis points on the session. WTI crude bounced back above US$67 a barrel, gold edged lower at US$2,911 per ounce, bitcoin slipped below US$87,000 and the VIX settled at just over 23.
From AAP netdesk:
The Australian share market on Friday dropped to its lowest close in more than six months, just three weeks after hitting an all-time high. The benchmark S&P/ASX200 index fell 146.5 points on Friday, or 1.81%, to 7948.2, while the broader All Ordinaries dropped 147.9 points, or 1.78%, to 8178.5. It was the third straight week of declines for the ASX200, giving up 3.9% since last Friday's close and eclipsing the 3% decline from a fortnight ago - at the time was the worst loss in more than two years.
Ten of the ASX's 11 sectors closed in the red, with IT stocks dropping 3% after Wall Street's tech-focused Nasdaq officially went into correction mode.
Banks continued to sell off and weighed heavily on the local bourse as the financial sector fell 2.5%. The Commonwealth Bank was down 3.3% on Friday and more than 5% for March to $148.50 per share, it's lowest price since November.
Energy stocks were down 1.9% and more than 7% lower for the week, as ongoing uncertainty over Donald Trump's trade war on China, Canada and Mexico continued, tempering global trade expectations and holding oil at its lowest price since September.
Materials could have been worse, only down 2.3% for the week, after China announced fresh stimulus and held its 5% growth target steady, despite rising tensions with the US.
Consumer staples was the only sector to edge higher on Friday, clawing an extra 0.4%, but was down more than 6% on a week ago.
From Shane Oliver, AMP:
Global share markets were mixed over the last week. US shares were whacked by ongoing tariff uncertainty and fell 3.1% and this also weighed on Japanese shares which fell 0.7%. But Eurozone shares rose 0.7% on the back of likely fiscal stimulus in Germany and another ECB rate cut and Chinese shares rose 1.4% helped by news of more stimulus. Australian shares fell another 2.7% taking the ASX 200 back below the 8000 level as erratic US tariff announcements added to uncertainty and a correction in overvalued bank shares continued. Eurozone bond yields rose around 40 basis points on the back of a likely big fiscal easing in Germany and this pulled up yields in the US, Japan and Australia. Prospects for more fiscal stimulus in Europe also pulled up the Euro and pushed down US dollar. This in turn saw the $A, metal prices and gold prices rise. Oil prices fell though on global growth concerns and the iron ore price also fell. Interestingly, the global policy moves with tariffs in the US and stimulus in Europe have seen US shares and the US dollar give up all their gains since the US election whereas Eurozone shares are near record highs. Australian shares and the $A are just getting buffeted by all the global policy uncertainty.
The past week has seen another round of erratic tariff announcements from Trump with: an extra 10% tariff on imports from China (taking it to well above 30%); the 25% tariffs on Canada (10% on oil) and Mexico starting on Tuesday only to see a delay till 2nd April for autos announced on Wednesday and then a delay again till 2nd April for all goods covered by the USMCA “free trade” deal (which is around half of their exports); and Trump announcing an investigation into lumber imports and plans to put tariffs on agricultural imports on 2nd April. And then there are the tariffs on steel and aluminium to start in the week ahead and plans for reciprocal tariffs, tariffs on the EU and tariffs on various industries (semi conductors, autos, pharmaceuticals, copper, etc) set to start from 2nd April. So 2nd April looks like being the big day and its kind of looking like the Canadian and Mexican tariffs will get rolled into broader announcements then around “reciprocal tariffs” and various industry tariffs. Trying to make sense of all this and work out the end point for the tariffs is guess work as Trump’s motivation seems to vary wildly – eg the flow of people and fentanyl were given as the reason for the tariffs on Canada and Mexico but they have already moved on that and yet he has told auto makers not to come back for another extension as he wants production to be in the US and more broadly he is focussed on the rest of the world “ripping us off”. The tariffs on Mexico and Canada, assuming they fully go ahead on 2nd April, along with those on China and steel and aluminium in the next week will take the average effective tariff rate on imports to the US to around 11.5%, up from 3% in January and its highest since the early 1940s. And Trump isn’t finished yet.
Trump’s chaotic policy making will come with a cost to the US economy and global growth. Rough estimates suggest that the tariffs on China, Canada and Mexico will directly knock around 0.5% off US and Chinese GDP and more off Canada and Mexico. They could also add around 0.7% to US inflation this year resulting in the Fed keeping rates higher for longer. But as noted there is more to go. More broadly, Trump’s erratic and inconsistent policy making with no certainty as to the end point on tariffs, uncertainty flowing for Musk’s DOGE cuts to the Federal workforce and service delivery and geopolitical uncertainty with Trump seeming to side more with Russia than allies like Europe, Canada and Mexico all risk a broader hit to the US economy as consumers and businesses curtail spending in the face of policy uncertainty. As can be seen in the next chart US trade policy uncertainty is exploding.
Its hard to see how Australia won’t face some direct tariffs on our exports to the US. Even if we avoid the 25% tariff on our steel and aluminium exports (which is looking questionable) we likely face tariffs on our pharmaceutical exports (which are more than double the value of our steel and aluminium exports to the US) or meat (which is our biggest export – and he is saying he will tariff agriculture from 2nd April) or more broadly via his reciprocal tariffs where he could take a dislike to lots of things like to the GST (which would be totally irrational but then…) or that we like Aussie Rules and rugby and not gridiron. The key to remember though is that compared to other countries we are a small exporter to the US with a total value of $24bn worth last year or 0.9% of our GDP. That is similar to the value of Australian exports China restricted in 2020 with little impact on the macro economy. The main threat to Australia by far comes from Trump’s trade war leading to a hit to global trade and growth leading to less demand for our exports.
Curated by James Gruber, Joseph Tayor, and Leisa Bell
A full PDF version of this week’s newsletter articles will be loaded into this editorial on our website by midday.
Latest updates
PDF version of Firstlinks Newsletter
ASX Listed Bond and Hybrid rate sheet from NAB/nabtrade
Listed Investment Company (LIC) Indicative NTA Report from Bell Potter
Plus updates and announcements on the Sponsor Noticeboard on our website