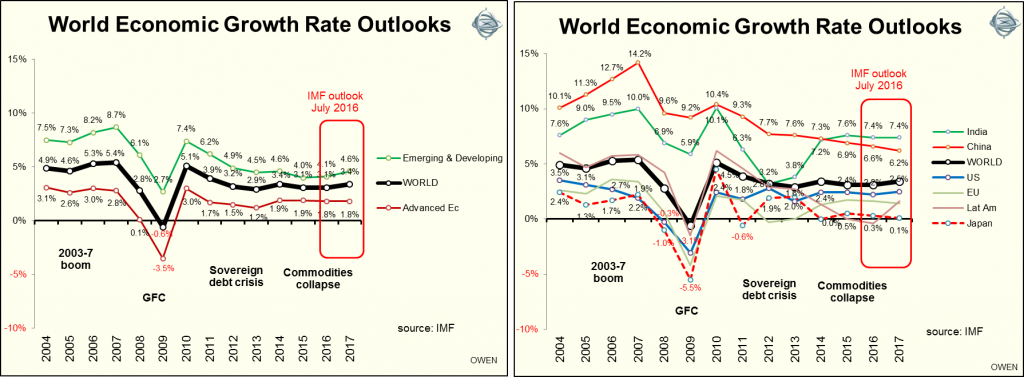
Global economic growth is expected to be around 3% in 2016 (about the same as in 2015) and then at least another 3% in 2017. These growth rates are near long-term growth levels, and indicate quite benign outlooks. Growth expectations have been revised downward a little over the past year, mainly in response to the ‘Brexit’ vote at the end of June 2016. The following charts show economic growth rates and outlooks in major regions and countries, based on IMF numbers.

In the major economies:
US growth is expected to remain at between 2% and 3% pa. There are continuing improvements in the housing market driving construction, employment and consumption. Manufacturing industries are also being boosted by cheaper energy, lower wages and higher productivity. This growth is more than making up for the fiscal tightening in the government sector, with trillion dollar deficits reducing to less of than half of that level.
European growth will continue at sub-3% for some time, driven mainly by Germany and also by the PIIGS as they recover from their deep recessions. The main risk to growth is deflation and the ever-present risk of a major banking crisis at the core, especially in Germany.
Japanese ‘Abenomics’ policies worked well in 2013-2015 in depressing the yen and boosting share prices, but did nothing to improve overall growth nor to get inflation into consistently positive territory. The economy is still very weak.
Chinese growth rates peaked in 2007 and have been declining ever since. The government is committed to propping up growth with ever-more debt to political pet projects to keep the population employed and quiet. As bad debts build up in the state-controlled banking sector and privately funded ‘shadow banking’ sector, and property prices continue to sky-rocket, the next credit collapse is bound to happen sooner or later. However, the government is in a relatively good position to restructure banks, demand and employment, just as it has done in the past.
All of this refers to economies but that has little bearing on share prices as we shall see.
No relationship between economic growth and stock market returns
One of the main problems with the traditional top-down approach to assessing the outlook for stock markets is that it assumes that economic growth drives earnings growth and that earnings growth drives stock prices (or at least that expectations of economic growth and expectations of earnings growth drive stock prices), or perhaps even that expectations of economic growth drive stock prices directly.
None of these assumptions hold true very often. There is no meaningful statistical correlation between economic growth and stock market returns, either at a global level or in individual countries. We consider the global picture first, since economies are highly interconnected and stock markets are also highly correlated.
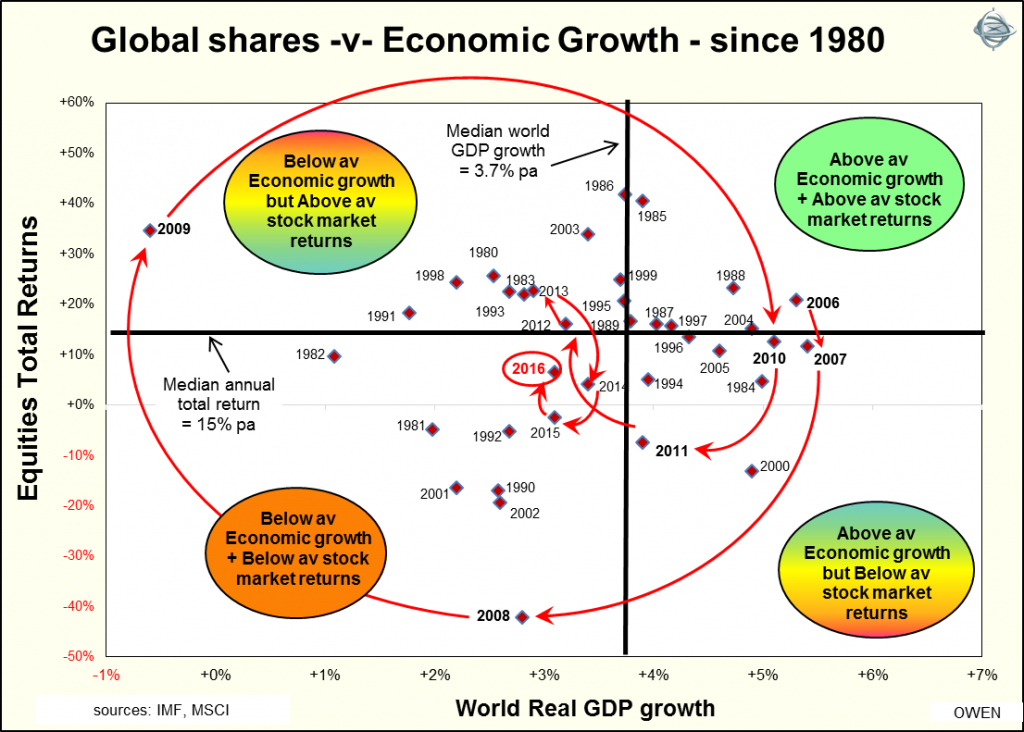
Only rarely does above average world economic growth coincide with above average stock market returns. In only 2 years in the past 32 years since 1980 has this been the case – 1988 and 2006.
Also, in only 4 years has below average economic growth coincided with below average stock market returns – 1981, 1990, 2001 & 2002.
In fact at least half of the time when economic growth was above average, stock market returns were below average, and at least half of the time when economic growth was below average (including in recessions), stock market returns were above average.
This can be seen in the following chart of world real GDP growth and world stock market total returns in each year since 1980 (and the orange line shows changes in the most recent years):

Most experts expect years in top right or bottom left quadrants
If there was any consistent positive relationship between economic growth and stock market returns, most years would be either:
- in the top right segment (good economic growth coinciding with good stock market returns)
- or in the bottom left segment (poor economic growth coinciding with poor stock market returns).
But this is not the case in the real world. At least half the years turned out to be good for economic growth but not good for shares (bottom right section) or bad for economic growth but good for shares (top left section). There is a similar story when looking at cross sectional returns in individual countries in any particular year, and this is also the case so far in 2016.
Despite the global gloom and growth downgrades this year, stock markets in most countries are doing quite well, with three straight months of gains since the ‘Brexit’ panic at the end of June.
I have observed over many years that dire warnings about economic slowdowns from esteemed bodies like the IMF (most recently after the Brexit vote) are often followed by share price rallies, and bullish statements about economic growth (notably at the tops of boom) are often followed by share price collapses. A further problem with the economic top-down approach is the fact that economists never forecast recessions and they are notoriously late in recognising them when they do occur. When the numbers are broken into countries, those with the best stock market returns this year are where the recessions are the deepest.
Conclusion
There is no reason the lowering of economic growth outlooks this year – notably following the Brexit vote – will lead to lower share prices.
We should not blindly assume that high/improving (or low/deteriorating) economic growth rates will lead to or accompany good equity returns (or poor returns in the case of low/deteriorating economic outlooks), as most market economists and commentators do.
Ashley Owen is Chief Investment Officer at independent advisory firm Stanford Brown and The Lunar Group. He is also a Director of Third Link Investment Managers, a fund that supports Australian charities. This article is for general information and does not consider the personal circumstances of any individual.