The market's stock price reactions appear to be disregarding any evidence that contradicts the 'Goldilocks' narrative for the economy. Many corporate results and company communications from August 2024 reporting season, however, seem to echo the poor conditions that we experienced back in 2019, a period overshadowed by the subsequent Covid years.
Weaker than expected guidance abounds
After assessing the tone of management guidance for sales, earnings and dividends, we see a two-to-one negative skew of guidance below what brokers were expecting before the results.
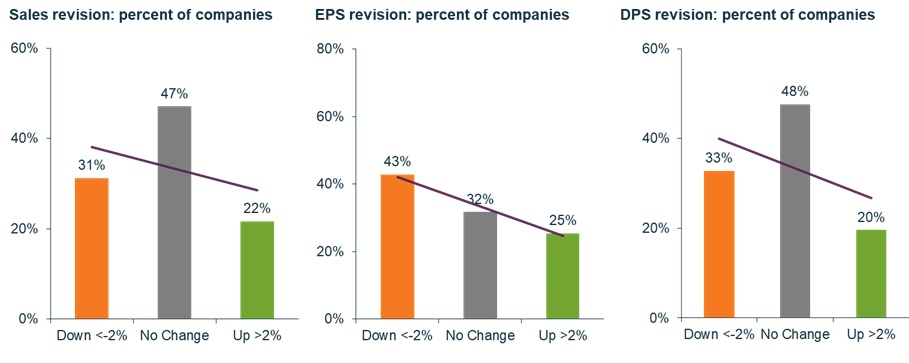
Brokers unsurprisingly adjusted their next 12 months forecasts closely in line with the negative guidance, leading to more than 40% of companies receiving downgrades to their EPS forecasts versus only a quarter receiving upgrades.
The biggest driver of the weak guidance from management was the slowing inflation environment that everyone seems to be wishing for. The result of this is a less desirable, slowing sales environment.
For the first time since August 2020, we saw a downgrade skew to the sales per share (SPS) line, which had been much more resilient until now due to inflation. This slowing sales environment, sitting at around 2% p.a. growth, is making it a lot harder for companies to maintain or grow EPS.
The environment is looking like 2019
Putting those revision downgrades into context, the net breadth of the number of companies receiving upgrades versus downgrades was somewhat negative, but we note that it was not terrible versus recent history. However, the size of the mean EPS revision (-3%) was the worst since 2019 and the second worst for the decade.
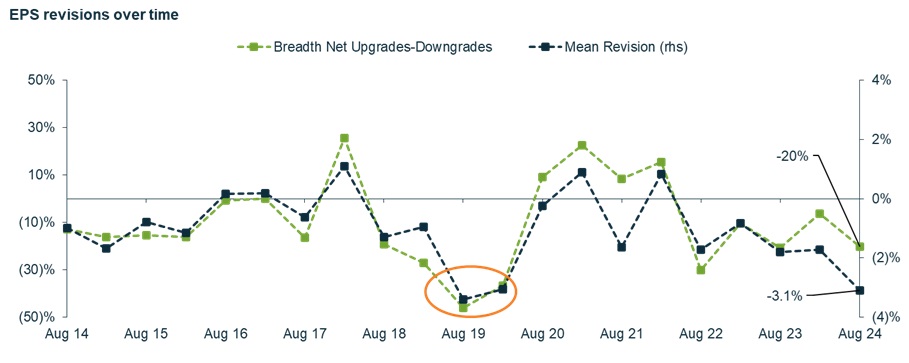
While this poor revision statistic is in part driven by the concentration of the S&P/ASX 200 in the large cap miners who experienced commodity price downgrades, and weakness in demand from China’s excess capacity, it is truly a signal of where we are in the economic cycle.
The low point in 2019 was when economic conditions were slowing, earnings and profit expectations were being cut, and rates were getting cut. Covid seems to have distorted the market’s collective memory of how bad these conditions were, and we are seeing similar conditions now.
Income scorecard reflects slowing environment
We have also updated our Income Scorecard to capture any changes post reporting season in earnings and dividend expectations.
The scorecard allows us to track how sectors and individual companies have delivered on the market’s forecast dividend expectations over the last 12 months, and if their dividend expectations are providing any inflation protection or growth expectations. Our scorecard allows us to look more closely at the potential income outcomes for the type of higher quality income opportunities within the S&P/ASX 200 that we consider for inclusion in our retirement income-focussed portfolios.
In our analysis we limit the universe to focus on results of true income opportunities only, those that meet a minimum franked yield threshold, and our proprietary assessment of sufficient quality and liquidity for an income investor. This leaves us with around 100 stocks out of the S&P/ASX 200.
We also strip out the impact of stock price movement when looking at the growth in forecast yield over the last 12 months by assuming a static stock price based on the start of the period. This allows us to see if the changes in yield are due to true earnings expansion or just share price changes.
In keeping with the slowing sales and earnings environment, we are also seeing poor DPS outcomes over the last 12 months, and ongoing subdued growth expectations across the sectors:
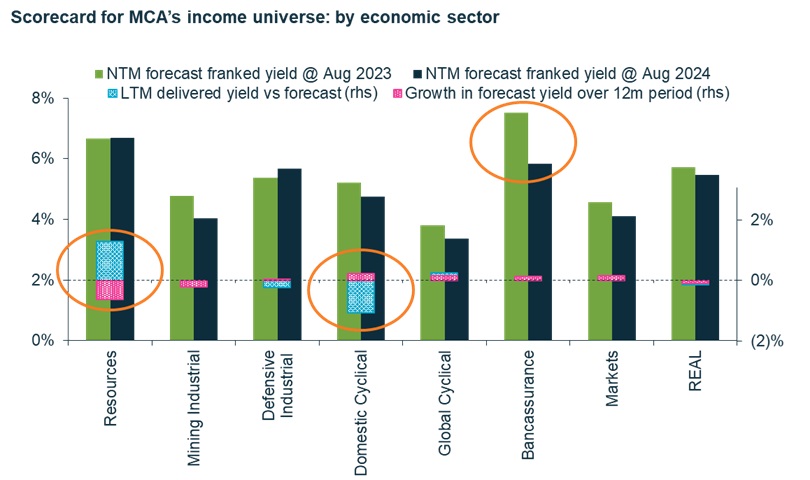
A key highlight over the past 12 months is that the resource stocks have continued to deliver good dividends versus expectations 12 months ago. However, the outlook is a lot tougher now, and most of the downgrades in future dividends can be found in this sector.
A particular stock of concern is Woodside Energy Group, where their M&A decision to invest in two new projects in the US have put a lot more stress on their ability to have enough free cash flow to fund strong dividends going forward.
The other standout concern was with the banks, which did deliver good earnings results, and reasonable or flat dividends over the last 12 months. However, there has been no growth to their forecast DPS because the underlying fundamentals haven't improved. The only thing that has changed is share prices.
Commonwealth Bank of Australia is a prime example of this. The bank is now at a level that is hard to call a strong dividend paying stock. The price being paid for the Bank at this point is unprecedented, and as a result the yield has dropped to below even the bond yield. To us, there is no fundamental basis for its P/E ratio, apart from the weight of passive investors creating a supply / demand issue. This has resulted in everyone analysing the price rather than the fundamentals. We warn people to remember that bubbles never last.
Concerns flowing into further dividend conservatism
A concerning trend overall for dividends is that companies are becoming even more conservative, in both their payout ratios, and also the level of debt ratios that they are willing to run. The average payout ratio across the market has dropped from 62% pre-Covid to 53% now, and companies have similarly dropped their amount of debt/revenue from 33% to 22%.
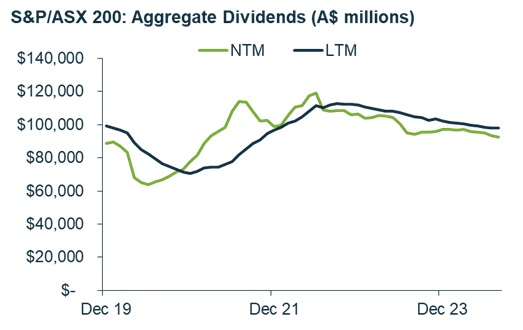
This hoarding of retained earnings, which is also not being reinvested into growth areas or areas with the highest return, is a worry for us. The lack of pressure being put on boards and management around payout ratios in recent times is a byproduct of the momentum driven market and the lack of scrutiny on fundamentals. Once the momentum bubble bursts, we do expect to see a return to dividends, and more focus on improving shareholder value.
Muted profit growth expectations amid extreme valuation spreads
Combining the results, guidance, revisions and fundamental insight gained from engagement and the macroeconomic reality, we are left with a less-than-ideal outlook for company profits. The forecast for next 12-month profit growth for the S&P/ASX 200 is down to just 2%, with the most negative expectations in the resources space, and most positive in industrials. However, given the slowing sales growth environment, we do question how much more of that growth can be wrung from gross margin expansion.
Despite the poor profit outlook, the market remains disconnected from this impending reality. We are witnessing a situation where Valuation spreads between the cheap and expensive stocks in the market, either by simple P/E measures or our proprietary Valuation research, are back at near extreme levels. There have been only three points in recent market history when the valuation spread has been this wide: pre-dotcom bubble, GFC and Covid.
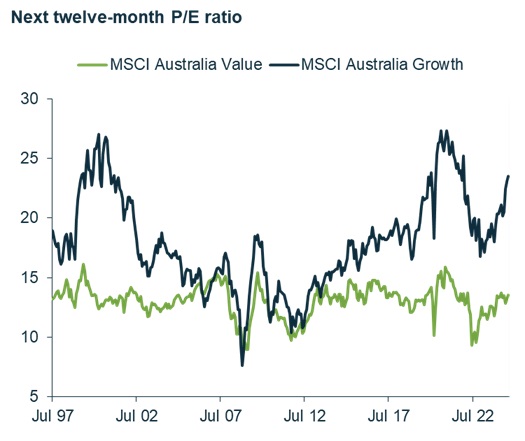
This dispersion has hurt active manager performance over the past 12 months, and particularly managers exposed to Value factors. However, this is where we see the opportunity is going forward. In today's environment of wide Valuation spreads and potential rate cuts, it is likely today’s cheap stocks will prove more defensive than the expensive Growth stocks.
While it is difficult to pick an exact turning point in market sentiment, we believe that now is the time for investors to evaluate the balance in their portfolios. This environment can be navigated, but it is as important as ever for investors to be discerning in their stock picking.
Reece Birtles is Chief Investment Officer at Martin Currie Australia, a Franklin Templeton specialist investment manager. Reece is also the lead portfolio manager for MCA’s Value Equity, Equity Income and Diversified Income & Growth strategies. Franklin Templeton is a sponsor of Firstlinks. This article is general information and does not consider the circumstances of any individual. The information provided should not be considered a recommendation to purchase or sell any particular security. It should not be assumed that any of the security transactions discussed here were, or will prove to be, profitable.
For more articles and papers from Franklin Templeton and specialist investment managers, please click here.