The Federal Budget and the level of government debt are hot topics in the media once again, so an update on the facts will provide some context for the debate.
Government debt levels and interest burden
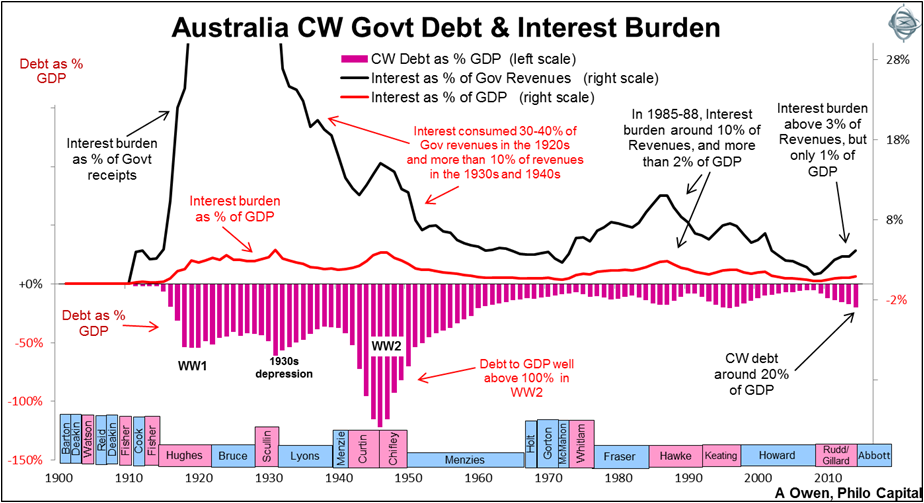
This first chart shows the level of Commonwealth (CW) Government debt measured in three ways:
- debt relative to national income (GDP) - pink bars on the lower section of the chart
- government interest burden relative to national income – black line
- government interest burden relative to government income (mainly tax receipts) – red line

Where we are now?
The current position (mid February 2015) is that Commonwealth Government debt securities outstanding total $356 billion, or around 22% of national income (GDP). (Source: Australian Office of Financial Management)
But this excludes many other types of debts, including unfunded ‘defined benefit’ pension liabilities, other financial liabilities and commitments and derivative exposures. It also excludes assets held to fund those other liabilities, for example, the Future Fund’s assets to fund future government pension liabilities.
Interest being paid on debt securities is $16 billion per year or $44 million per day. This equates to 4.5% of Commonwealth Government revenues and about 1.1% of national income.
The above chart shows that on these measures the level of debt and the level of interest paid on that debt are very low, and on a par with the low levels of the 1950s to the 1970s.
Australia’s debt-to-GDP ratio first increased dramatically to fund the war-time spending during WW1 and then rose again in the 1930s depression. The main reason for the increase in the ratio in the 1930s was the dramatic collapse in national income, not an increase in debt. In fact between 1929 and 1932 the level of debt actually reduced by 15% but nominal GDP contracted by 31%.
Australia did not go on a Keynesian deficit spending spree in the 1930s depression like the US because we simply were not able to borrow. The Commonwealth and state governments had run out of credit availability in foreign debt markets by 1929, and the Commonwealth’s then wholly-owned Commonwealth Bank refused to lend it more money. So the only option was to stick to the savage and deflationary austerity of the 1931 ‘Premier’s Plan’ and force all holders of domestic government debt into a haircut restructure deal not unlike the recent Greek debt restructure.
The chart shows that after WW2 the debt to GDP ratio reduced in the 1950s but it was not because the government paid off debt. The level of debt kept growing steadily, but the national income grew even faster, so the debt to GDP ratio declined although the level of debt rose. The rising level of debt was mostly put to good use being invested in productive purposes, mainly infrastructure to support the rapidly growing population, driven by the post-war ‘baby boom’ and the aggressive ‘populate or perish’ immigration program.
Interest burden
The black line on the above chart shows that interest payments on government debt consumed 30-40% of all government revenues in the 1920s (on a par with the PIIGS and Japan today) and it was still consuming more than 10% of revenues in the 1930s and 1940s (on a par with the US today). The interest burden was then brought down in the post-war boom in the 1950s and 1960s, as national income rose at a much quicker rate than the rise in interest rates.
In recent years the interest burden of government debt was at its lowest level ever in 2007-2008 when the level of debt was also at its lowest level.
However, the current interest burden (at around 1% of GDP and around 4% of tax receipts) is no higher now than it was in the 1950s to the 1970s. This is due to the relatively low level of debt and the relatively low interest rates today.
'Lazy balance sheet'
If Australia was a company its national debt would be labelled a very ‘lazy balance sheet’ and the CEO and Chairman would be thrown out by shareholders for not borrowing enough to invest for future growth!
Australia has always been a country in which the opportunities for growth and investment have far exceeded the local savings pool available to fund its development, and so it has always had to import people and capital, in the form of equity and debt.
Many people liken a country to a household, where it is prudent to have no debt, or at least to pay off debts as quickly as possible. However a country is more like a company than a household. In a household, the breadwinner(s) stop generating income and have to draw down their accumulated savings during decades of retirement. Companies and countries can exist forever (in theory anyway) and they can (and probably should) carry debt as long as the cost of debt (interest) is lower than the additional income generated from the investments funded by that debt.
In truth, the reality for most countries is probably somewhere between these two views. Australia has an aging population and rising welfare and health costs, but it is still the best placed among its ‘developed’ country peers (in the OECD for example) thanks to its relatively favourable demographics. It is far better placed than Japan and northern European countries that have declining populations, declining workforces and declining tax-payer bases. Those countries are indeed more like households, where the breadwinners in aggregate are reducing their income-generating ability and are literally dying off.
Government deficits
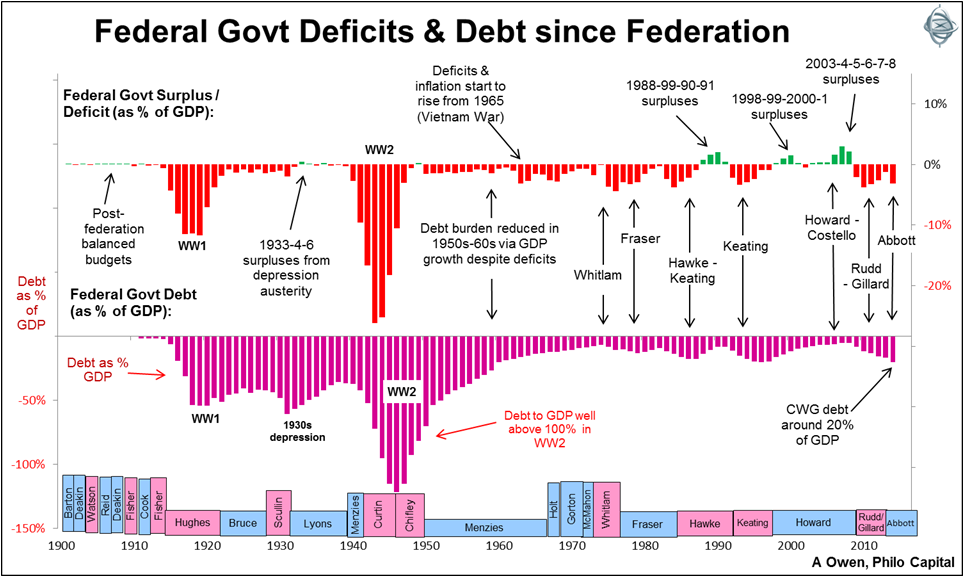
Governments borrow money when they run a budget deficit – where their outlays exceed their revenues. The second chart shows government surpluses or deficits for Australia (upper section of the chart) together with the Debt to GDP ratio (lower section) for reference.

This chart shows that the Abbott government deficit performance (relative to national income) is similar to those under Rudd/Gillard, Keating, Hawke, Fraser and Menzies, but far lower than the deficits in both World Wars and in the 1930s depression.
‘Good’ or ‘bad’ debt?
When a household, company or country borrows money, the debt ideally should be used to generate future revenues that will repay the interest on the debt and also repay the principal due at maturity.
In the case of a household there is said to be ‘good debt’ (debt that is used to buy an asset or activity that generates enough income or capital growth to more than cover the principal and interest on the debt), and ‘bad debt’ (debt that is used to fund lifestyle expenses). The argument goes that it is the same with a country, and debt used to pay pensions, welfare and healthcare costs fall into the category of ‘bad debt’ that must be avoided because it doesn’t generate revenue to cover the interest on the debt. Whether it is good or bad debt, rising pensions, welfare and healthcare costs in a country with an aging population must either be kept in check or met with rising tax revenues. If not it will require larger deficits and debts in the future.
Focus on income instead of debt
This brief story has shown that most of the big changes in Australia’s Debt to GDP ratios over time were due to changes in the national income (ie the output from the economy) more than changes in the level of debt. While most of the shrill media debate is focused on the absolute level of debt, what is more important is a debate about what the debt is spent on, and whether it will maximise the productive capacity of the economy in the future.
Australia still has a relatively ‘lazy balance sheet’ (ie a relatively low level of debt) and is still a country with far more opportunities and development potential than the savings pool available locally to fund it, together with a growing and relatively young population relative to our ‘developed’ country peers.
With record low interest rates and global investors clamouring to lend us money, this is the time to borrow at ultra-low rates locked in for long periods and use the money wisely to fund long term projects to maximise Australia’s long term economic growth. But that requires long term vision and that is sadly lacking in our leaders from all sides of politics in Australia.
Ashley Owen is Joint CEO of Philo Capital Advisers and a director and adviser to the Third Link Growth Fund.